
In this blog, our SEN expert, Dr. Jo Van Herwegen, addresses the causes of the recent rise in the number of SEN children in the UK, especially in the early years:
The government announced additional funding for supporting children with Special Educational Needs (SEN) in schools during the autumn budget in 2021. However, recently we were contacted by schools who have seen a rise in number of children with SEN, especially in the early years, which may question if this additional funding is going to be sufficient to make a difference. Here, I explore the evidence about this and factors that could potentially explain changes in numbers. Before we get started, let’s explain some terminology:
SEN support refers to the children that require additional support often provided by teachers and SENCo but the child does not have an Education, Health and Care plan (EHCP).
EHCP refers to a pupil who has an EHC plan or statement of SEN where a formal assessment has been made. A document is in place that sets out the child’s needs and the extra help they should receive.
What does national data tell us?
Let’s start with what the national data tell us.
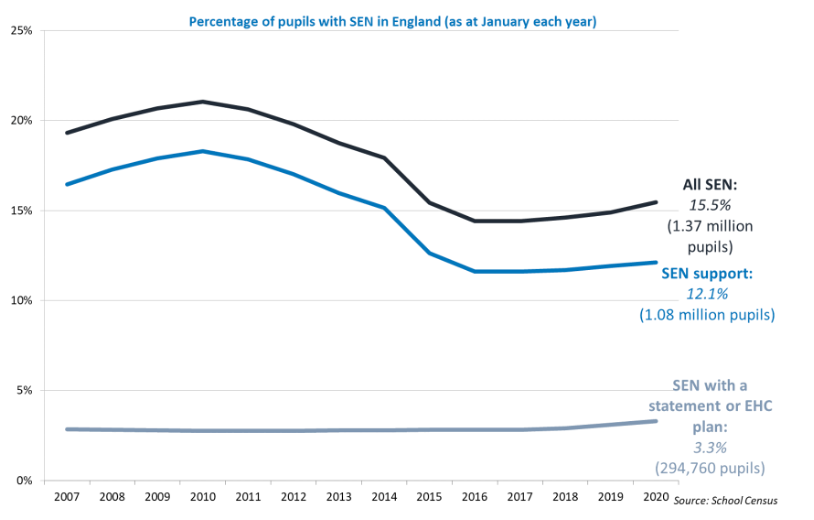
- The number of pupils with special educational needs (SEN) in England has increased for a third consecutive year to 1.37 million in January 2020. The percentage of pupils with an EHC plan has risen to 3.3% of the total pupil population1. Figure 1 below shows these changes.
- Across England: SEN is most prevalent among boys at age 9 (23% of all boys), and for girls at age 10 (13% of all girls)2. In 2-year-olds, the proportion with SEN increased from 3.2% to 3.5%. For 3- and 4-year-olds, the percentage with SEN increased from 6.3% to 6.6%. Both the percentage with an EHC plan and the percentage with SEN support increased1.
- Factors associated with SEN diagnosis: Those identified with SEN are more likely to speak English at home, are eligible for free school meals and related to ethnicity, SEN are most prevalent in travellers of Irish heritage and Gypsy/Roma pupils with 30% and 26% respectively. Travellers of Irish heritage and black Caribbean pupils had the highest percentage of pupils with EHC plans (4.5% and 4.4% respectively).
- If we look at different types of primary need we see that: autism is most common need for those with an EHCP across all ages from 4 to 17 (for age 4, 37% of those with EHCP have primary need of autism), whilst majority of 4 year-olds on SEN support (59%) have a primary type of need of Speech Language and Communication needs (SLCN)2.
So, nationally, indeed there has been a rise in SEN, including during the early years and in preschool years. The most frequent SEN is autism for those with EHCP and SLCN for those on SEN support. There is evidence that the increase is larger in some authorities than others.
Figure 1 Percentage of children with SEN per year
Why is there this rise in SEN numbers?
There is not a great deal of research in this area. There are three main possible answers. The first looks to history, the second to changes in awareness, the third to changes in assessment and diagnostic criteria.
Historical events
From 2010 to 2015, there was a steady decline in numbers of SEN. The first drop between 2010 and 2014 has been argued to be a response to Ofsted report in 20103 related to the fact that SEN might have been over-diagnosed before 2010. The second drop seen from 2014 onwards has been linked to the launch of SEND reforms and the failure of many children to be transferred from the old system to the new system4. The argument in this case is that the steady increase we have seen in last few years is just the catching up of the system, with children now having been re-assessed appropriately and re-assigned to the appropriate level of support.
Greater awareness
SEN has been in the spotlight in the media. This means more awareness on what support children are entitled to. In addition, more teachers are now trained on SEN and thus are more likely to spot the early indicators of SEN. This would also fit with the observation that there is a rise in SEN in the early years. The new Early Years Foundation Stage Profile assessments at age five have large effects on the chances of an individual child being identified with SEND according to a new report5 by the Education Policy Institute.
When it comes to the different types of needs, there have been specific awareness campaigns for autism6 and for language development needs7. In our own research, we see that people endorse fewest neuromyths related to autism8 and we also speculated that awareness campaigns around autism may have helped this.
Assessment and diagnostic criteria
The prevalence of autism seems to be rising, with currently 1-2% of children in the UK receiving a diagnosis9. However, this rate seems to vary between countries. A number of explanations have been proposed for this increase, including more awareness, and changes to the diagnostic criteria (introduced in 2013) which broadened of the spectrum10. However, recent research has shown that the differences between those with a diagnosis of autism and those without one are becoming smaller11, suggesting indeed that autism might be over-diagnosed in some cases.
One explanation for why more autistic children are receiving an EHCP is a mismatch in how support is assessed: whereas schools (who make decision on SEN support) focus mostly on communication, language and literacy skills, local authorities (who assess for EHCP support) make decisions that are more aligned with personal, social and emotional development5.
Yet, we need to be careful with conclusions made about increases in specific types of needs categories, as diagnostic labels such as autism and language delay or SCLN are not always consistently applied, especially in the early years; and often language difficulties co-occur with other developmental disorders, including autism12.
Why differences between local authorities?
Some differences in rates between regions may be explained by differences in the composition of local populations, and therefore differences in the numbers of families with factors associated with SEN, including socioeconomic status and ethnicity, identified in government reports1, 2.
Regional differences may also be produced by the types of schools within a certain area. Parents sometimes are willing to move to certain areas to obtain provision. This was supported by a recent EPI report5: the chance of a child being identified with SEND was explained by the practices within a school rather than individual aspects of the child or the local authority.
Is there any evidence of misidentification of SEN in the early years?
The EPI report5 did find that summer-born children were over-represented with SEND, that is, an over-representation of children who were at the younger end of their age cohort and therefore slightly less mature. Moreover, the relative age effect appeared to be mediated through lower Early Years Foundation Stage Profile attainment for younger children. This finding suggests that assessors of the EYFSP fail to take into account the development that occurs in children over a 12 month-time span.
In sum
There has indeed been a rise in SEN, including during the early years and in preschool years. This may represent a ‘catch-up’ of the system following policy changes; it may reflect greater awareness of SEN amongst educators; or changes in assessment and diagnostic criteria.
References
- https://assets.publishing.service.gov.uk/government/uploads/system/uploads/attachment_data/file/985162/Special_educational_needs_Publication_May21_final.pdf
- https://assets.publishing.service.gov.uk/government/uploads/system/uploads/attachment_data/file/814244/SEN_2019_Text.docx.pdf
- OfSTED (2010). The Special Educational Needs and Disability Review: A Statement is Not Enough. London: OfSTED.
- Curran, H (2015) SEND reforms 2014 and the narrative of the SENCO: early impact on children and young people with SEND, the SENCO and the school.In: BERA Annual Conference, 15-17 September 2015, Queen’s University, Belfast, Northern Ireland.
- Hutchinson, J (2021). Identifying pupils with special educational needs and disabilities. Education Policy Institute. https://epi.org.uk/wp-content/uploads/2021/03/SEND-Indentification_2021-EPI.pdf
- National Autistic Society. (2021). Professional development. Retrieved from https://www.autism.org.uk/what-we-do/professional-development
- Raising awareness of developmental language disorder. https://radld.org/
- Gini, S., Knowland, V., Thomas, M. S. C., & Van Herwegen, J. (2021). Neuromyths About Neurodevelopmental Disorders: Misconceptions by Educators and the General Public. Mind, Brain, and Education. doi:10.1111/mbe.12303
- Russell, G., Rodgers, L. R., Ukoumunne, O. C., & Ford, T. (2014). Prevalence of parent-reported ASD and ADHD in the UK: Findings from the millennium cohort study. Journal of Autism and Developmental Disorders, 44(1), 31–40. https://doi.org/10 .1007/s10803- 013- 1849- 0
- American Psychiatric Association (Eds.) (2013) Diagnostic and statistical manual of mental disorders: DSM-5. 5th edn. Washington, DC: American Psychiatric Association.
- Rødgaard, E. M., Jensen, K., Vergnes, J. N., Soulières, I., & Mottron, L. (2019). Temporal Changes in Effect Sizes of Studies Comparing Individuals With and Without Autism: A Meta-analysis. JAMA psychiatry, 76(11), 1124–1132. https://doi.org/10.1001/jamapsychiatry.2019.1956.
- Dockrell, J. E., and Hurry, J. (2018). The identification of speech and language problems in elementary school: diagnosis and co-occurring needs. Dev. Disabil.81, 52–64. doi: 10.1016/j.ridd.2018.04.009